
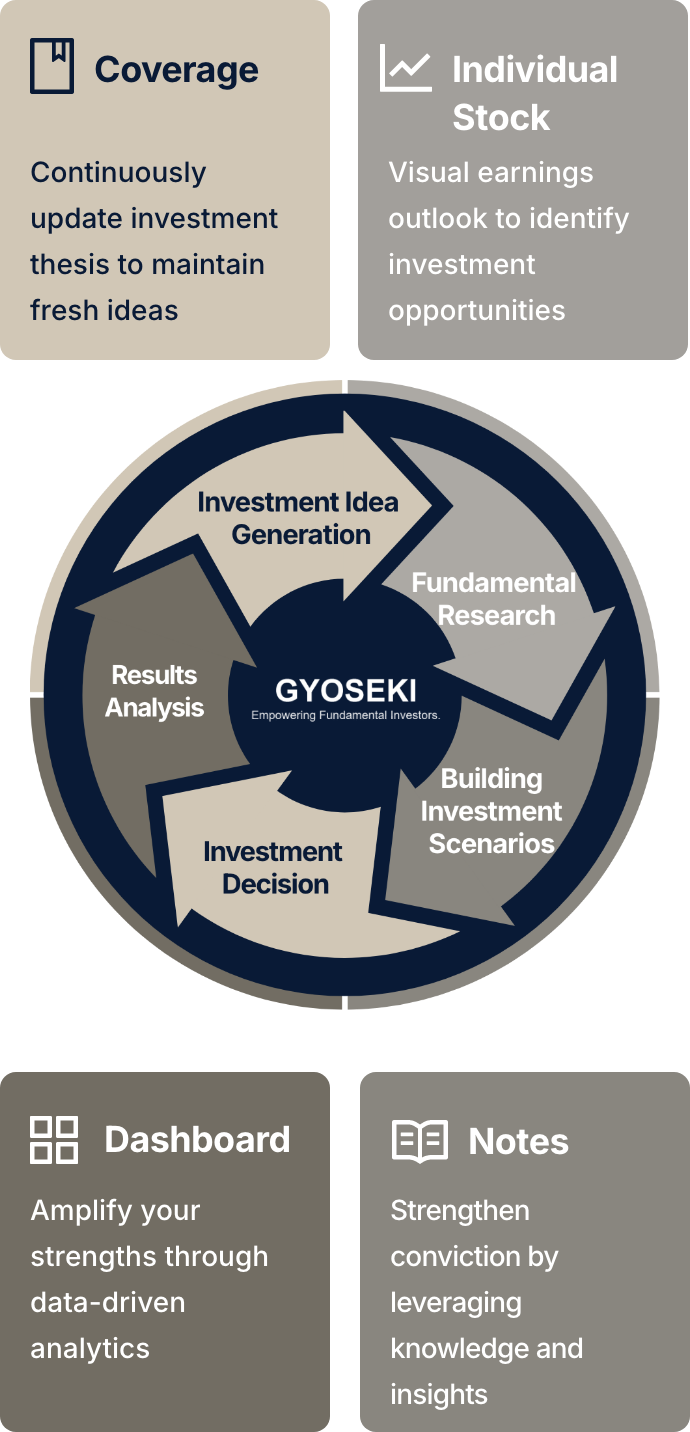
Gyoseki is a knowledge platform that visualizes the full investment cycle, helping investors accumulate insights and realize growth.
What is GYOSEKI?
Have you encountered these challenges?
- You can’t find a tool that systematically captures and enhances your investment process
- Lack of clear metrics makes it difficult to translate feedback into actionable steps
- Factors like "conviction" and "timing" are hard to quantify
- Short-term results and portfolio performance alone can’t accurately measure young analysts’ true ability
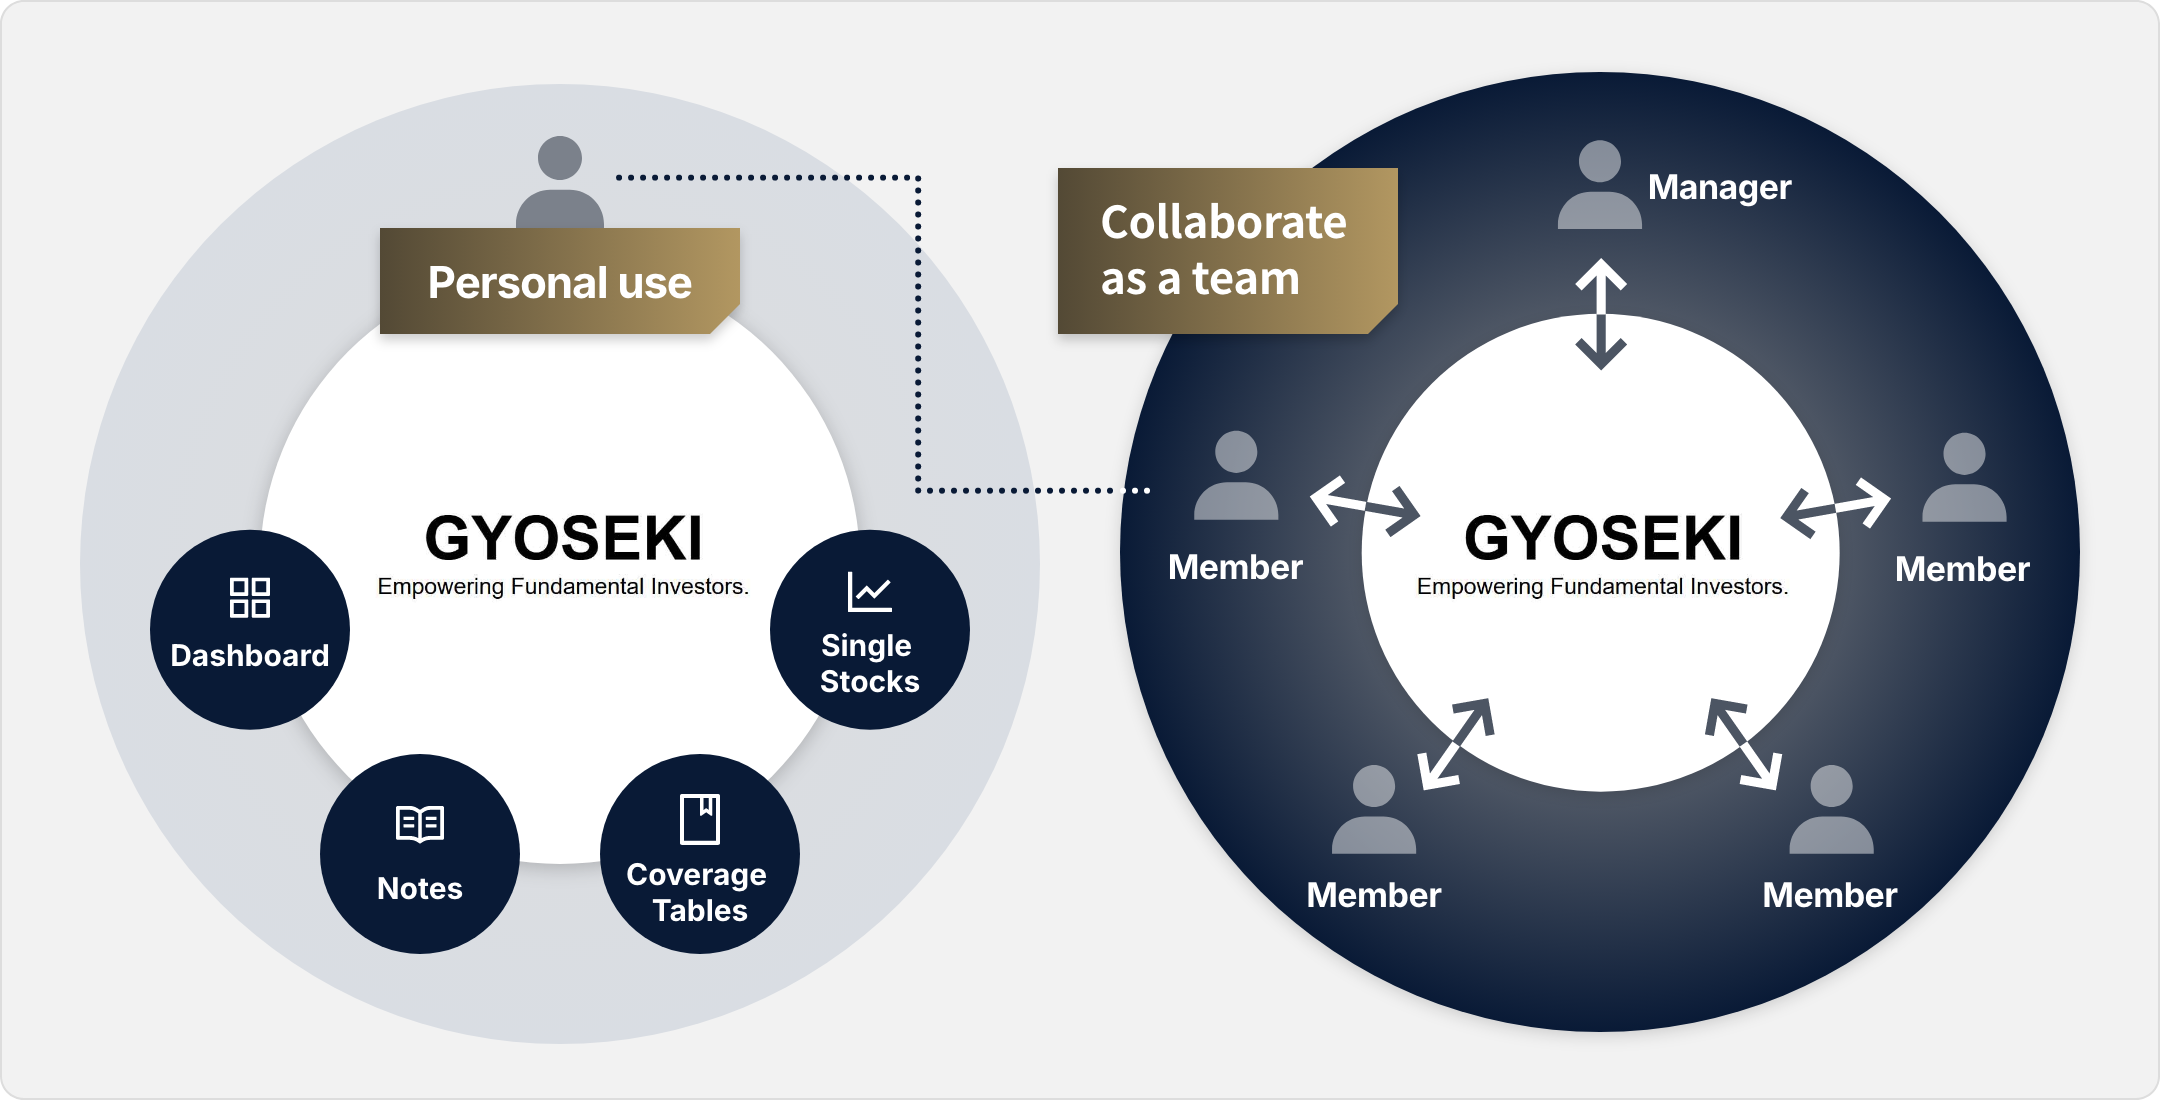
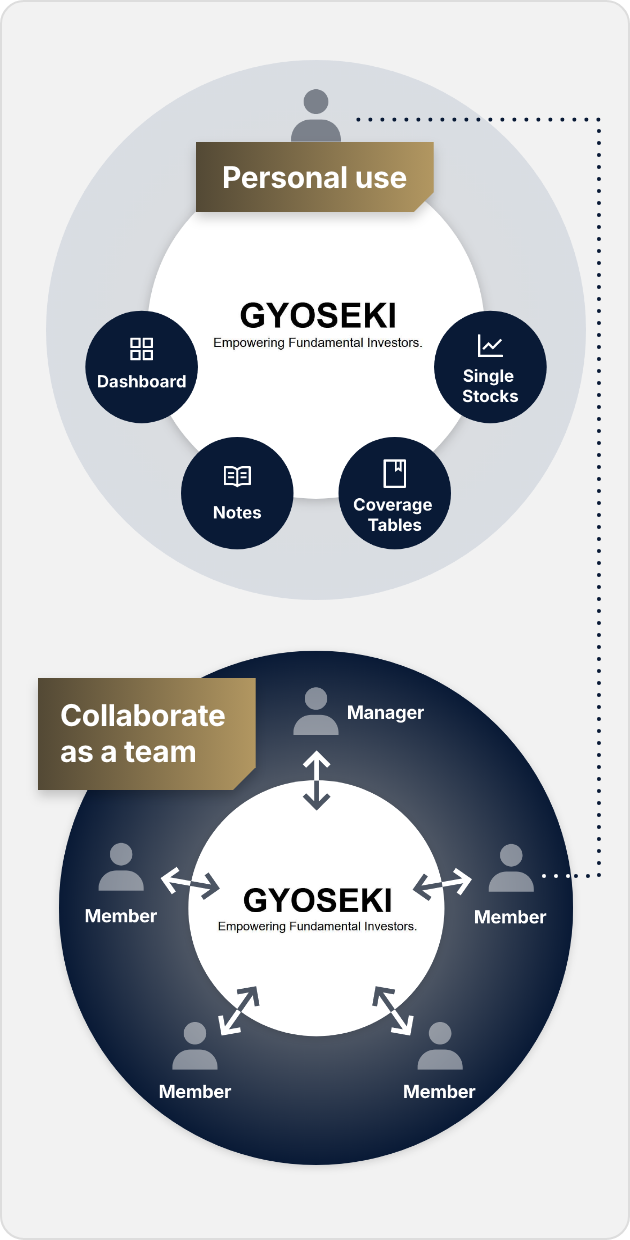
Gyoseki is a knowledge platform that unifies, visualizes, and shares the entire investment cycle—so teams can grow faster with accumulated insight.
- Streamline data entry and management
- Facilitate seamless idea sharing within the team
- Visualize data
- Support team and individual skill development

Fund managers who want real-time visibility into their analysts’ latest investment ideas

For senior analysts aiming to expand coverage and raise their game

For young analysts aiming to sharpen skills, expand ideas, and boost their value-add
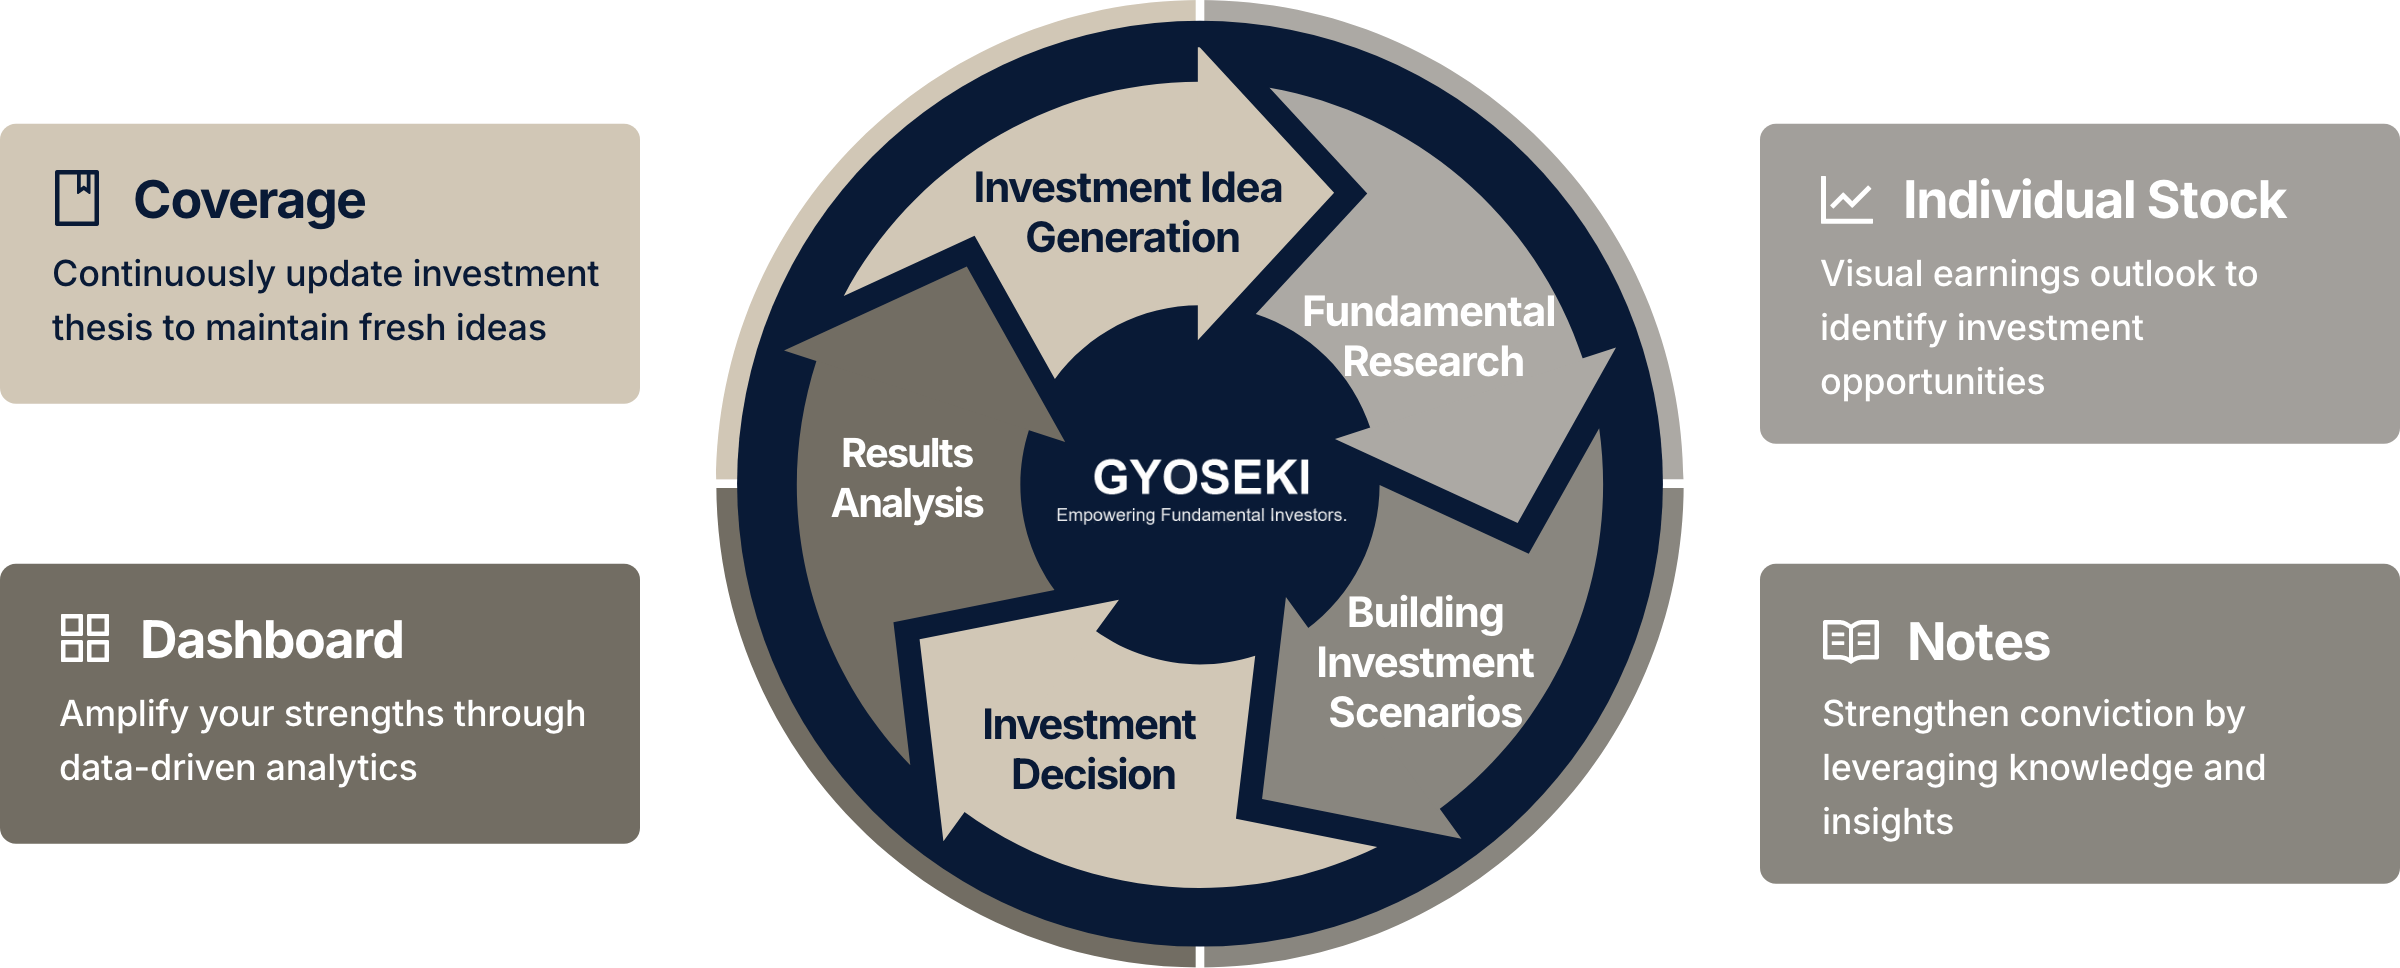
Key Features
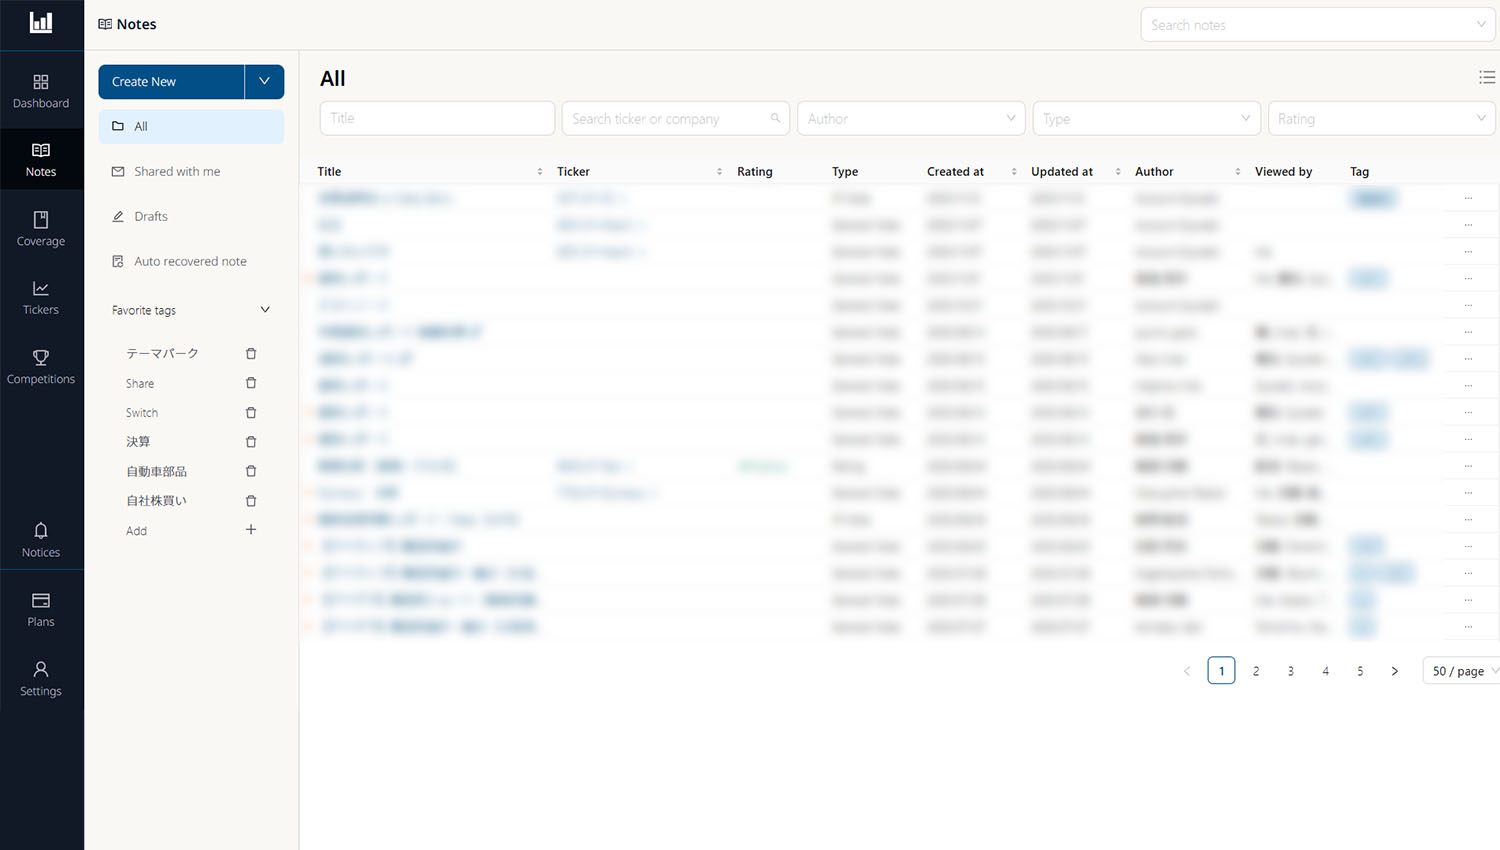
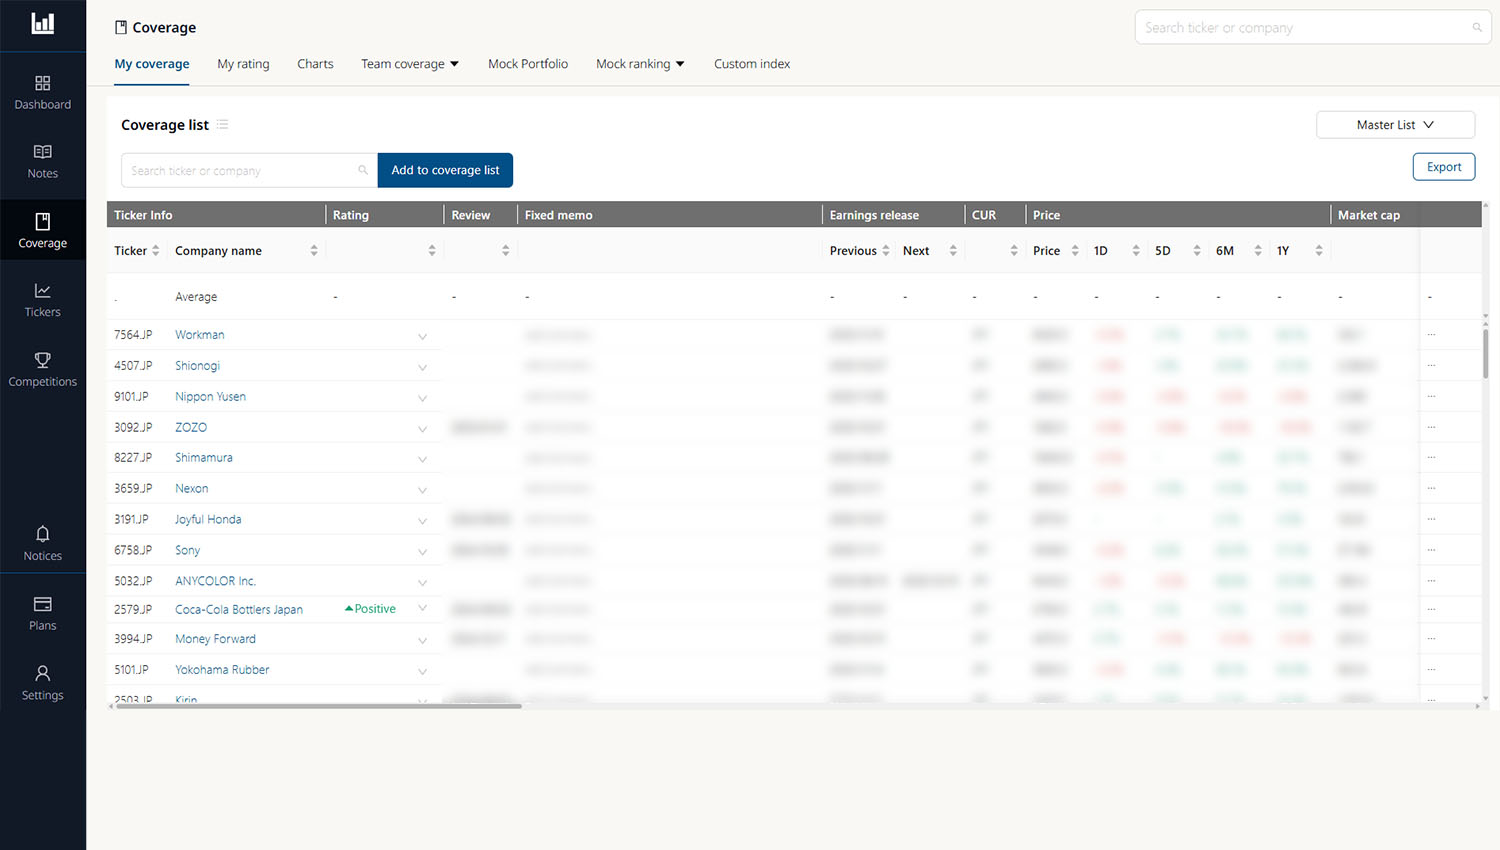
Team Coverage Management and Note Sharing
― Eliminate information fragmentation and siloing, eradicating duplicate work ―
Centrally manage company analysis and earnings forecasts, establishing a "Single Source of Truth" that can be shared across the entire team.
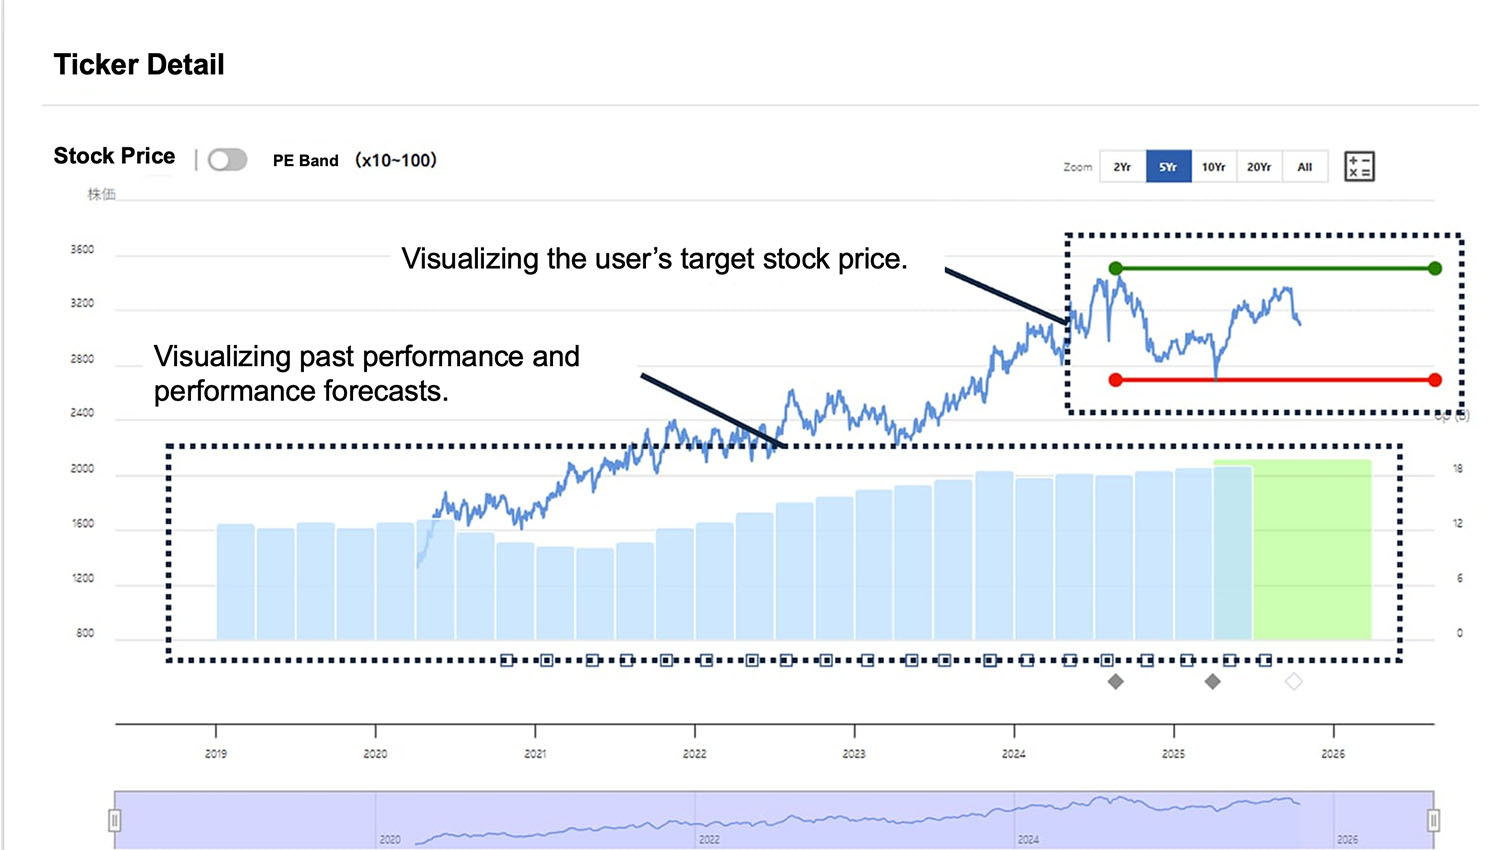
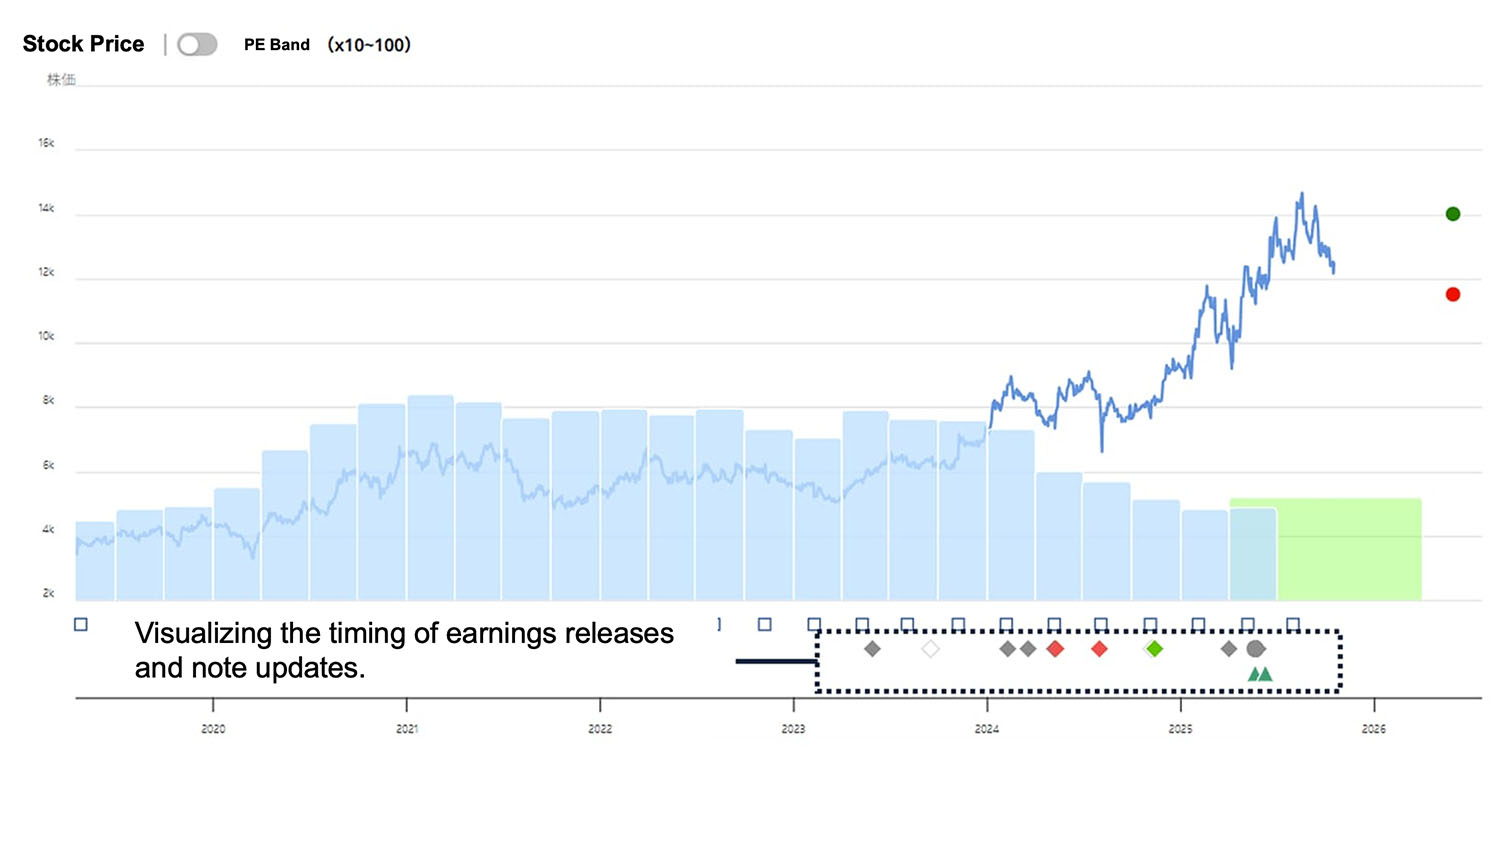
Quantification and Visualization of Decision Criteria
― Validating and Learning from Investment Decisions ―
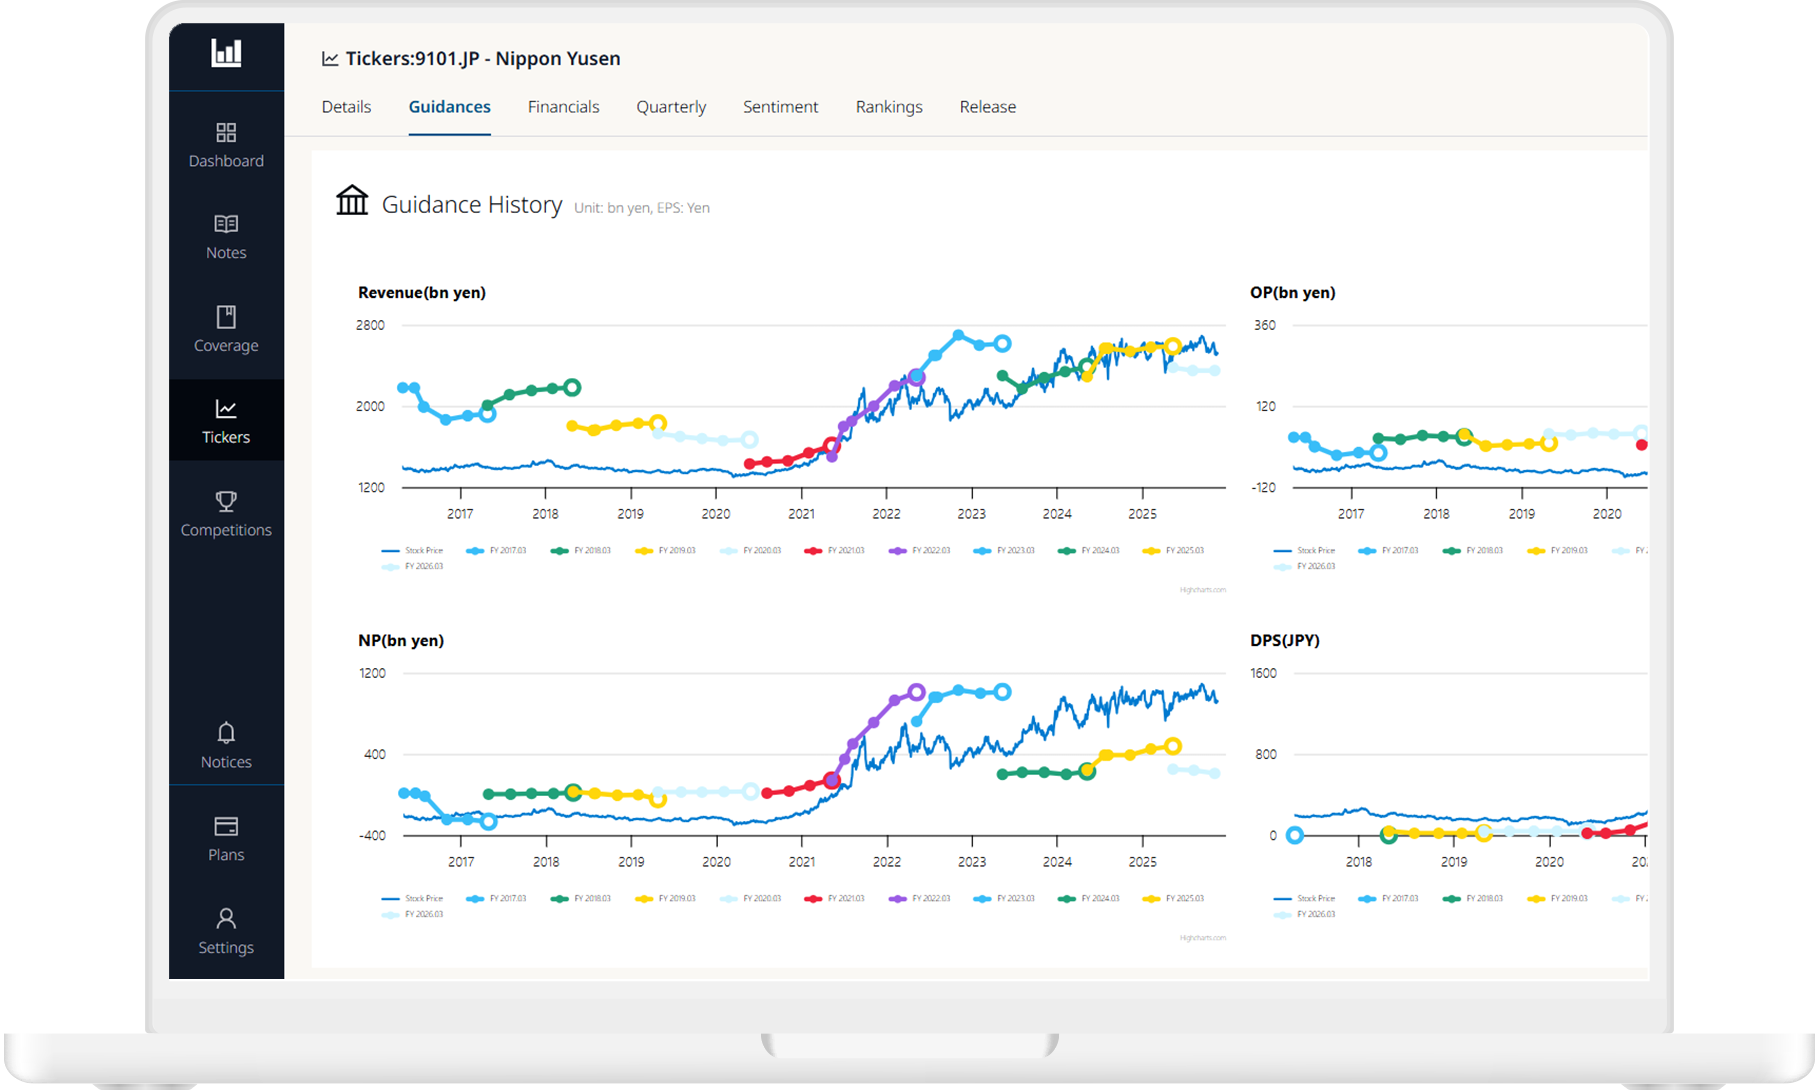
Automatically log past trades and target price setting dates on charts, overlaying them with related earnings information and market price movements.
This enables quantitative validation of decision-making soundness and allows the "success factors" of previously siloed analysis to be learned and shared as objective data.
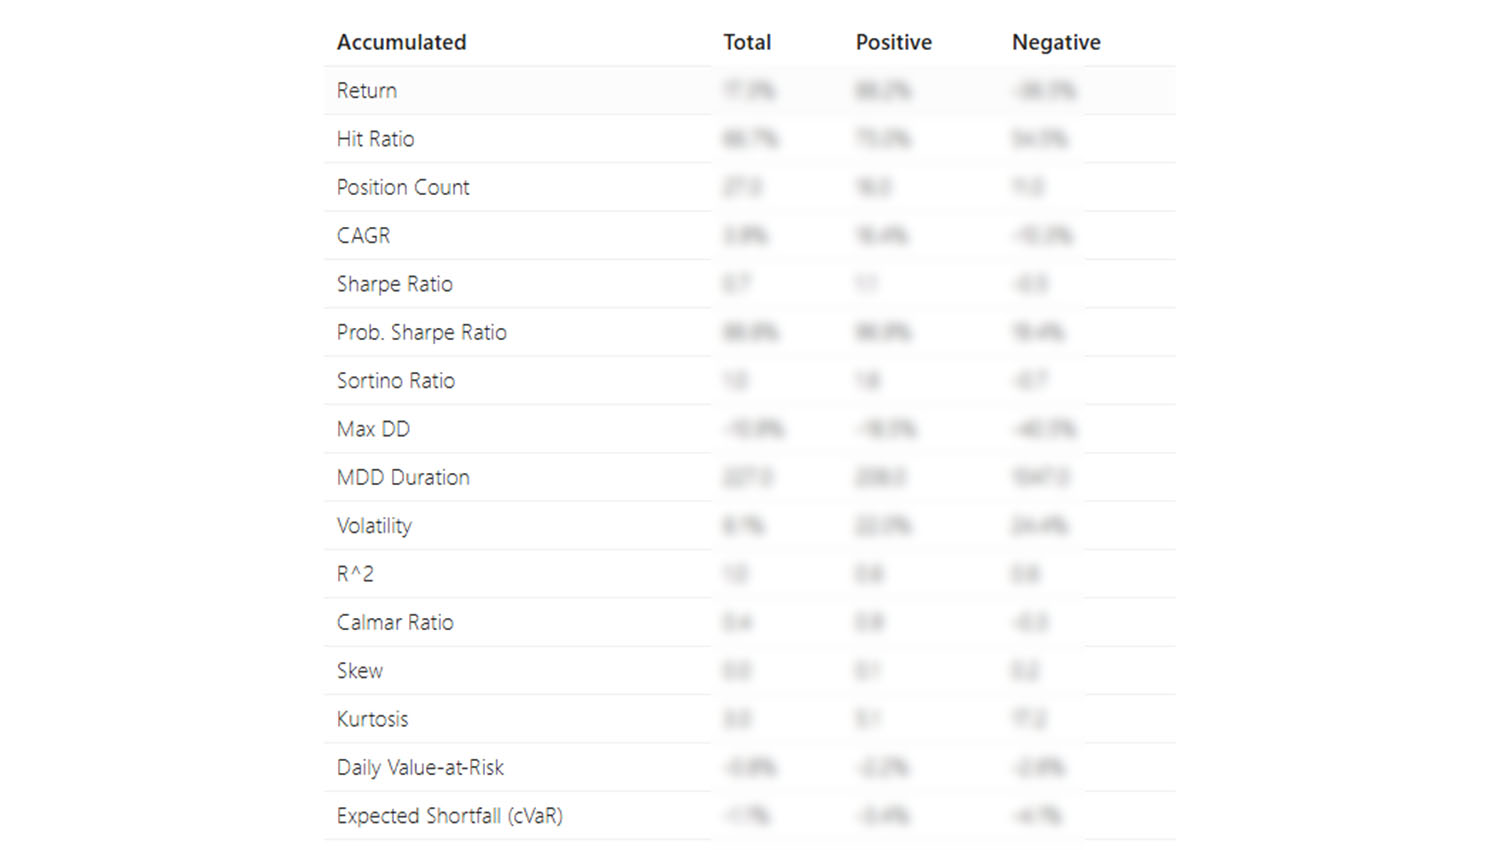
Continuous Feedback System to Enhance Analytical Precision
― Visualizing Research Capability Based on Objective Metrics ―
This visualizes true analytical capability growth based on supporting objective metrics.

LTM Progress Display

Target Price Management

Financial Results Display

Company Guidance & History Display

Automatic Revision Notifications

Create Custom Index
From our users
Users consistently highlight improved efficiency and training effectiveness.
* For confidentiality reasons, actual company and personal names are omitted.
Plan and Price
Choose a Preferred Plan
Choose a Preferred Plan
Free For competition and event participants Free | Standard For broad coverage across many stocks 9,000y/mo | Enterprise For in-depth, deep-dive analysis ASK | |
|---|---|---|---|
| Notes | |||
| Create Notes (Japanese stocks) | ● | ● | ● |
| Character Limit | 5,000characters | 5,000characters | Unlimited |
| Attachment Size Limit | 10MB | 10MB | Unlimited |
| Viewing Period | Archived after 6 months | Unlimited | Unlimited |
| Create Notes (non-Japanese stocks) | - | - | ● |
| Ticker | |||
| Japanese stock financial data | Upto 5 years | Upto 20 years | Upto 20 years |
| Download JP stock financial data | - | ● | ● |
| Earnings forecasts | ● | ● | ● |
| Sentiment (submit / view) | ● | ● | ● |
| Guidance tracker | Upto 5 years | ● | ● |
| LTM graph | Upto 5 years | ● | ● |
| Coverage | |||
| Create Stock Groups | 3 teams | Unlimited | Unlimited |
| Create Custom Index | 3 teams | Unlimited | Unlimited |
| Graphs for commercial use | - | - | ● |
| Download Coverage Table | - | - | ● |
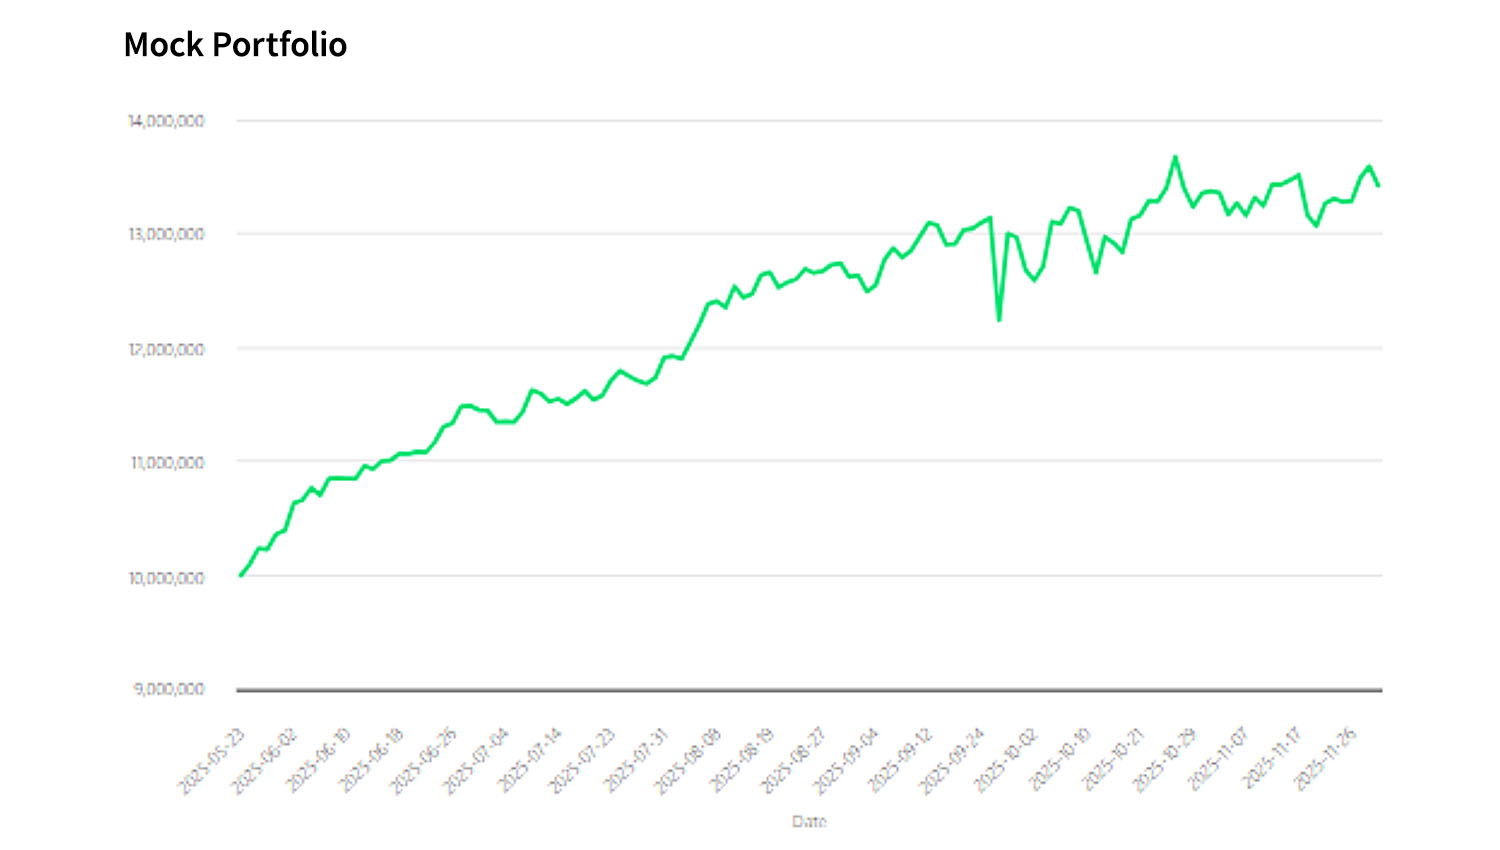
| Mock Portfolio | ● | ● | ● |
| Dashboard | |||
| Rating Analytics | - | ● | ● |
| Event Participation | ● | ● | × |
※ Please note that we may request usage limitations in cases of unusually high or excessive access beyond normal use
FAQ
Questions
- Yes, you can use Gyoseki individually. The platform automatically manages your stock notes and ratings in chronological order, and it also notifies you of earnings announcements and changes in company guidance, helping you conduct research more efficiently.
- Team members can share stock ratings, target prices, and IR notes. With a single input, updates are automatically reflected across all designated teams and their members, improving the efficiency of information sharing.
- Free: Designed for competition and event participation, where you want to show your work.
- Standard: Best for covering many stocks broadly. Helps organize the latest information with coverage tables.
- Enterprise: Allows you to manage longer interview notes, large attachments, and foreign stock analysis. Ideal for those who conduct deep research.
- Yes, you can cancel by switching to the Free Plan. Please note that payments already made are non-refundable.
- You can participate with either the Free Plan or Standard Plan.
- It is an anonymized distribution chart of earnings forecasts submitted by other users. You can view it only after putting in your own forecast.You can see the range of market participants’ expectations as a reference. Individual users cannot be identified, and no information other than earnings forecasts is shared.
Disclaimer
The information on this site, including opinion reports, is intended solely for informational purposes and does not constitute investment advice offered by Gyoseki or related parties. Information on the site is not warranted or represented to be correct, complete, accurate or timely. Information on this site may contain forecasts regarding future business results and events, these statements are only forecasts and do not guarantee the accuracy or reliability of the contents. Gyoseki or related parties are not responsible for investment decisions, damages or other losses resulting from, or related to, use of this information, including our opinions. It is strictly prohibited to use any data or information provided for commercial purposes, and to copy, modify, process, store, sell, reprocess, transmit or redistribute it for the purpose of providing it to a third party. Past performance is no guarantee of future performance.